
Imagem numa resolução maior (arquivo SVG, de 1 024 × 768 pixels, tamanho: 81 kB)
Descrição do arquivo
| Descrição |
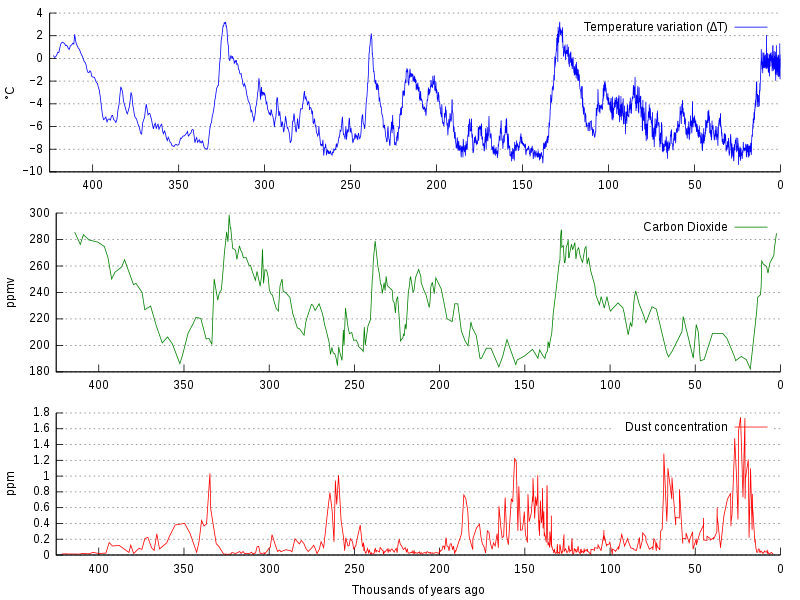
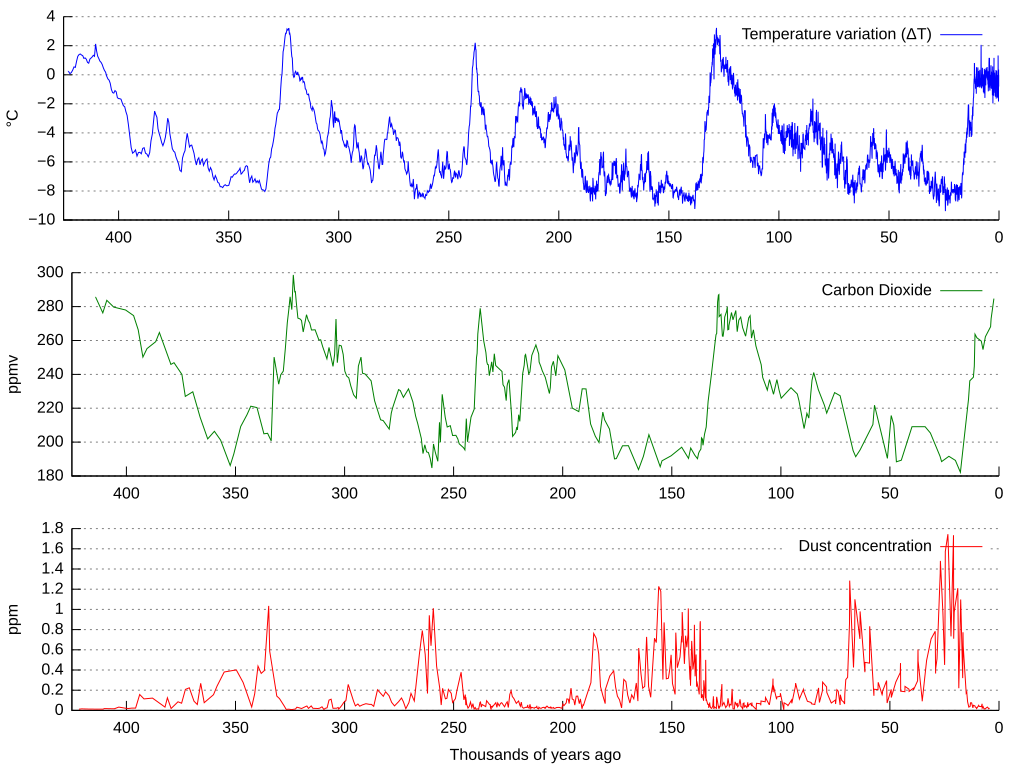
La bildo estas kopiita de wikipedia:en. La originala priskribo estas: Graph of CO2 (Green graph), temperature (Blue graph), and dust concentration (Red graph) measured from the Vostok, Antarctica ice core as reported by Petit et al., 1999. Higher dust levels are believed to be caused by cold, dry periods. The Earth's orbital eccentricity, tilt, and precession vary in a pattern over thousands of years. The IPCC notes that Milankovitch cycles drove the ice age cycles; CO2 followed temperature change "with a lag of some hundreds of years" (visible on a graph more zoomed in than this); and that as a feedback amplified temperature change. Among other factors, CO2 is more soluble in colder than in warmer waters. العربية: مخطّطٌ يُبيّن علاقة ثاني أوكسيد الكاربون ودرجة الحرارة وتركيز الغبار في قالب جليد فوستوك (بالإنجليزيّة: Vostok ice core) خلال 450,000 سنة الماضيّة |
| Data | |
| Fonte | Obra própria, baseada em: Vostok-ice-core-petit.png de NOAA |
| Autor |
Original: Desconhecido Vetor: |
| Outras versões |
Obras derivadas deste arquivo: |
| SVG desenvolvimento | Este(a) desenho vetorial foi criado com Gnuplot. Este arquivo é traduzido usando elementos SVG switch: todas as traduções são armazenadas no mesmo arquivo. |
Data sets used are:
- ftp://ftp.ncdc.noaa.gov/pub/data/paleo/icecore/antarctica/vostok/deutnat.txt
- ftp://ftp.ncdc.noaa.gov/pub/data/paleo/icecore/antarctica/vostok/co2nat.txt
- ftp://ftp.ncdc.noaa.gov/pub/data/paleo/icecore/antarctica/vostok/dustnat.txt
Código fonte
Gnuplot code
unset multiplot
set term svg size 1024,768
set output "vostok-data.svg"

set border 3
set xtics nomirror
set ytics nomirror
unset xlabel
unset ylabel

set grid y
set multiplot layout 3,1

set ylabel "°C"
plot [-425:0] [-10:4] \
        "deutnat.txt" \
        using (-$2/1000):4 \
        title "Temperature variation (ΔT)" \
        ls 3 \
        with lines

set ylabel "ppmv"
plot [-425:0] \
        "co2nat.txt" \
        using (-$1/1000):2 \
        title "Carbon Dioxide" \
        ls 2 \
        with lines

set xlabel "Thousands of years ago"
set ylabel "ppm"
plot [-425:0] \
        "dustnat.txt" \
        using (-$1/1000):2 \
        title "Dust concentration" \
        ls 1 \
        with lines
Explanation
After executing gnuplot, the resulting SVG file was manually changed to
* remove the negative signs for the x axis values
* change the [[:w:hyphen-minus|hyphen-minus]] characters in the temperature axis values to proper minus sign characters
| A utilização deste arquivo é regulada nos termos da licença Creative Commons Atribuição-Partilha nos Termos da Mesma Licença 3.0 Unported. | ||
| ||
| Esta marca de licenciamento foi adicionada a este arquivo durante a atualização da licença GFDL. |

|
É concedida permissão para copiar, distribuir e/ou modificar este documento nos termos da Licença de Documentação Livre GNU, versão 1.2 ou qualquer versão posterior publicada pela Free Software Foundation; sem Seções Invariantes, sem textos de Capa e sem textos de Contra-Capa. É incluída uma cópia da licença na seção intitulada GNU Free Documentation License. |
Registro de upload original
This image is a derivative work of the following images:
- Vostok-ice-core-petit.png licensed with Cc-by-sa-3.0-migrated, GFDL
- 2006-02-15T20:38:10Z Maksim 598x441 (31557 Bytes) La bildo estas kopiita de wikipedia:en. La originala priskribo estas: Graph of [[carbon dioxide|CO2]], [[temperature]], and dust concentration measured from the [[Vostok, Antarctica]] [[ice core]] as reported by Petit et al.
Carregada com derivativeFX
Histórico do arquivo
Clique em uma data/horário para ver como o arquivo estava em um dado momento.
| Data e horário | Miniatura | Dimensões | Usuário | Comentário | |
|---|---|---|---|---|---|
| atual | 13h01min de 25 de junho de 2021 | | 1 024 × 768 (81 kB) | wikimediacommons>Matěj Orlický | File uploaded using svgtranslate tool (https://svgtranslate.toolforge.org/). Added translation for cs. |
Uso do arquivo
As seguinte página usa este arquivo:
 " class="attachment-atbs-s-4_3 size-atbs-s-4_3 wp-post-image" alt="O que estudar para o enem 2023">
 " class="attachment-atbs-s-4_3 size-atbs-s-4_3 wp-post-image" alt="Qual melhor curso para fazer em 2023">
 " class="attachment-atbs-s-4_3 size-atbs-s-4_3 wp-post-image" alt="Enem: Conteúdos E Aulas On-Line São Opção Para Os Estudantes">
 " class="attachment-atbs-s-4_3 size-atbs-s-4_3 wp-post-image" alt="Como Fazer Uma Carta De Apresentação">
 " class="attachment-atbs-s-4_3 size-atbs-s-4_3 wp-post-image" alt="Como Escrever Uma Boa Redação">
 " class="attachment-atbs-s-4_3 size-atbs-s-4_3 wp-post-image" alt="Concurso INSS edital 2022 publicado">


