Phanerozoic_Sea_Level.png (523 × 360 pixels, tamanho: 23 kB, tipo MIME: image/png)
Este arquivo é do Wikimedia Commons e pode ser utilizado por outros projetos. Sua página de descrição de arquivo é reproduzida abaixo.

|
File:Phanerozoic Sea Level.svg é uma versão vetorial desta imagem. Ela deve ser usada no lugar desta imagem rasterizada, se não for de qualidade inferior.
File:Phanerozoic Sea Level.png → File:Phanerozoic Sea Level.svg
Para mais informações, consulte Ajuda:SVG.
|
Descrição do arquivo
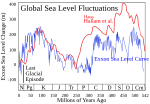
This figure compares the Hallam et al. (1983) and Exxon eustatic (global) sea level reconstructions for the Phanerozoic eon. The Exxon curve [1] is a composite from several reconstructions published by the Exxon corporation (Haq et al. 1987, Ross & Ross 1987, Ross & Ross 1988). Both curves are adjusted to the 2004 ICS geologic timescale.
Hallam et al. and Exxon use very different techniques of measuring global sea level changes. Hallam's approach is qualitative and relies on regional scale observations from exposed geologic sections and estimates of the areas of flooded continental interiors. Exxon's approach relies on the interpretation of seismic profiles to determine the extent of coastal onlap in subsequently buried sedimentary basins. Hallam is insensitive to rapid fluctuations in sea level. Exxon is sensitive to rapid fluctuations but tends to overinterpret local geologic changes resulting in bias towards reporting unphysical rapid fluctuations.
The depth scale is as reported by Exxon. Because Hallam is reported as qualtitative (i.e. uncalibrated), these sea level changes were scaled to match the Exxon record during the period 0–250 Myr.
A black bar is added to indicate the scale of sea level fluctuations during the last glacial/interglacial transition. This change occurred purely within the last 20 kyrs, and note that neither system of measurements is capable of resolving changes on this time scale. It also should be noted that very rapid fluctuations of similar scale are potentially possible during all periods during which large scale ice sheets are present (see: Phanerozoic climate change).
On the scale of this figure, the melting of all existing ice sheets would result in a sea level rise of ~80 meters. Changes on larger scales, which evidently occurred many times in the past, are the result of geologic changes in the structure of ocean basins. Essentially, such changes affect the average depth of the oceans relative to the continents.
Common symbols for geologic periods appear at the bottom.
Copyright
This figure was prepared by Robert A. Rohde from publicly available data and is incorporated into the Global Warming Art project.

|
É concedida permissão para copiar, distribuir e/ou modificar este documento nos termos da Licença de Documentação Livre GNU, versão 1.2 ou qualquer versão posterior publicada pela Free Software Foundation; sem Seções Invariantes, sem textos de Capa e sem textos de Contra-Capa. É incluída uma cópia da licença na seção intitulada GNU Free Documentation License.http://www.gnu.org/copyleft/fdl.htmlGFDLGNU Free Documentation Licensetruetrue |
| A utilização deste arquivo é regulada nos termos da licença Creative Commons Atribuição-Partilha nos Termos da Mesma Licença 3.0 Unported. | ||
| ||
| Esta marca de licenciamento foi adicionada a este arquivo durante a atualização da licença GFDL.http://creativecommons.org/licenses/by-sa/3.0/CC BY-SA 3.0Creative Commons Attribution-Share Alike 3.0truetrue |
References
- Hallam, A., Phil. Trans. Royal Soc. B 325, 437-455 (1989).
- Harland, W.B. and many others, A Geologic Time Scale, (1982).
- Haq, B., J. Hardenbol, P. Vail., Science, 235, 1156-1167 (1987).
- Ross, C.A. & J.R.P. Ross, Cushman Foundation for Foraminiferal Research Spec. Publ. 24, 137-149 (1987).
- Ross, C.A. & J.R.P. Ross in Sea-level Change: an Integrated Approach (Eds. Wilgus, C.K., Hastings, B.J., Posamentier, H., van Wagoner, J.C., Ross, C.A., and Kendall, C.G. St. C.), SEPM Spec. Pub. 42:71-108 (1988).
Notes
- Because Exxon traditionally used an in-house (i.e. unpublished) system for estimating the geologic age of stratigraphic sections it is not possible to perform an exact recalibration of the time scale. Instead it was adjusted assuming the Harland et al. 1982 time scale was a reasonable approximation.
derivative works
Obras derivadas deste arquivo:
Legendas
Itens retratados neste arquivo
retrata
image/png
Histórico do arquivo
Clique em uma data/horário para ver como o arquivo estava em um dado momento.
| Data e horário | Miniatura | Dimensões | Usuário | Comentário | |
|---|---|---|---|---|---|
| atual | 02h24min de 27 de dezembro de 2005 |  | 523 × 360 (23 kB) | wikimediacommons>Angrense | Variation of the sea level during the Phanerozoic eon. Source:English versin of Wikipedia. |
Uso do arquivo
As seguinte página usa este arquivo:


 " class="attachment-atbs-s-4_3 size-atbs-s-4_3 wp-post-image" alt="O que estudar para o enem 2023">
 " class="attachment-atbs-s-4_3 size-atbs-s-4_3 wp-post-image" alt="Qual melhor curso para fazer em 2023">
 " class="attachment-atbs-s-4_3 size-atbs-s-4_3 wp-post-image" alt="Enem: Conteúdos E Aulas On-Line São Opção Para Os Estudantes">
 " class="attachment-atbs-s-4_3 size-atbs-s-4_3 wp-post-image" alt="Como Fazer Uma Carta De Apresentação">
 " class="attachment-atbs-s-4_3 size-atbs-s-4_3 wp-post-image" alt="Como Escrever Uma Boa Redação">
 " class="attachment-atbs-s-4_3 size-atbs-s-4_3 wp-post-image" alt="Concurso INSS edital 2022 publicado">


