
Imagem numa resolução maior (arquivo SVG, de 531 × 324 pixels, tamanho: 90 kB)
A modified version of Image:Extinction Intensity.svg.
Changes:
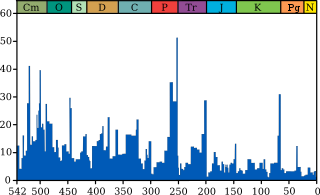
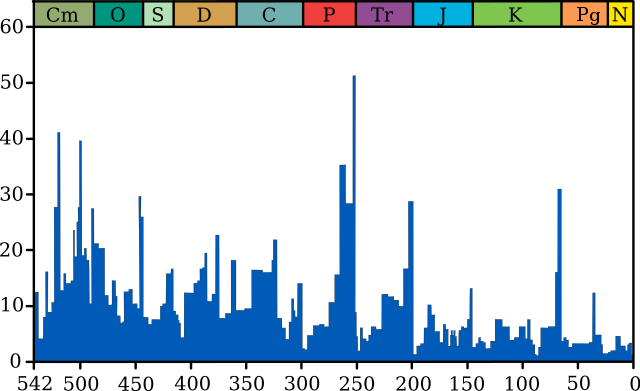
- Time runs from left to right (millions of years ago). Vertical axis is apparent percentage (not the absolute number) of marine animal genera becoming extinct.
- Periods are coloured as per the Paris system - see w:Template:Period color for full explanation
- Text removed so wikilinks can be floated over. See w:Template:Annotated image/Extinction for implementation.
- Cubic polynomial removed as this doesn't convey any useful information and is mainly an artefact.
- The caption on the original file is: Marine Genus Biodiversity: Extinction Intensity

|
É concedida permissão para copiar, distribuir e/ou modificar este documento nos termos da Licença de Documentação Livre GNU, versão 1.2 ou qualquer versão posterior publicada pela Free Software Foundation; sem Seções Invariantes, sem textos de Capa e sem textos de Contra-Capa. É incluída uma cópia da licença na seção intitulada GNU Free Documentation License. |
| A utilização deste arquivo é regulada nos termos da licença Creative Commons Atribuição-Partilha nos Termos da Mesma Licença 3.0 Unported. | ||
| ||
| Esta marca de licenciamento foi adicionada a este arquivo durante a atualização da licença GFDL. |
Descrição do arquivo
- Adapted from Image:Extinction Intensity.svg
This figure shows the genus extinction intensity, i.e. the fraction of genera that are present in each interval of time but do not exist in the following interval. The data itself is taken from Rohde & Muller (2005, Supplementary Material), and are based on the Sepkoski's Compendium of Marine Fossil Animal Genera (2002). Note that these data do not represent all genera that have ever lived, but rather only a selection of marine genera whose qualities are such that they are easily preserved as fossils.
In the original version of this chart, the "Big Five" mass extinctions (Raup & Sepkoski 1982) are labeled in large font, and a variety of other features are labeled in smaller font. The two extinction events occurring in the Cambrian (i.e. Dresbachian and Botomian) are very large in percentage magnitude, but are not well known because of the relative scarcity of fossil producing life at that time (i.e. they are small in absolute numbers of known taxa). The Middle Permian extinction is now argued by many to constitute a distinct extinction horizon, though the actual extinction amounts are sometimes lumped together with the End Permian extinctions in reporting. As indicated, the "Late Devonian" extinction is actually resolvable into at least three distinct events spread over a period of ~40 million years. As these data are derived at the genus level, one can anticipate that the number of species extinctions is a higher percentage than shown here.
Many of the extinction events appear to be somewhat extended in time. In at least some cases this is the result of a paleontological artifact known as the Signor-Lipps effect (Signor & Lipps 1982). Briefly, this is the observation that inadequate sampling can cause a taxon to seem to disappear before its actual time of extinction. This has the effect of making an extinction event appear extended even if it occurred quite rapidly. Hence, when estimating the true magnitude of an extinction event it would be common to combine together the events occurring over several preceding bins as long as they also show excess extinctions. This explains why many estimates of the magnitude of an extinction event may be larger than the 20-30% shown as the largest single bin for most of the extinctions shown here.
References
- Raup, D. & Sepkoski, J. (1982). "Mass extinctions in the marine fossil record". Science 215: 1501–1503. DOI:10.1126/science.215.4539.1501.
- Rohde, R.A. & Muller, R.A. (2005). "Cycles in fossil diversity". Nature 434: 209-210. DOI:10.1038/nature03339.
- Sepkoski, J. (2002) A Compendium of Fossil Marine Animal Genera (eds. Jablonski, D. & Foote, M.) Bull. Am. Paleontol. no. 363 (Paleontological Research Institution, Ithaca, NY).
- Signor, P. and J. Lipps (1982) "Sampling bias, gradual extinction patterns and catastrophes in the fossil record", in Geologic Implications of Impacts of Large Asteroids and Comets on the Earth, I. Silver and P. Silver Eds, Geol. Soc. Amer. Special Paper 190, Boulder Colo. p. 291-296.
For comparison

Histórico do arquivo
Clique em uma data/horário para ver como o arquivo estava em um dado momento.
| Data e horário | Miniatura | Dimensões | Usuário | Comentário | |
|---|---|---|---|---|---|
| atual | 09h02min de 21 de maio de 2008 | | 531 × 324 (90 kB) | wikimediacommons>Smith609 |
Uso do arquivo
As seguintes 2 páginas usa este arquivo:
 " class="attachment-atbs-s-4_3 size-atbs-s-4_3 wp-post-image" alt="O que estudar para o enem 2023">
 " class="attachment-atbs-s-4_3 size-atbs-s-4_3 wp-post-image" alt="Qual melhor curso para fazer em 2023">
 " class="attachment-atbs-s-4_3 size-atbs-s-4_3 wp-post-image" alt="Enem: Conteúdos E Aulas On-Line São Opção Para Os Estudantes">
 " class="attachment-atbs-s-4_3 size-atbs-s-4_3 wp-post-image" alt="Como Fazer Uma Carta De Apresentação">
 " class="attachment-atbs-s-4_3 size-atbs-s-4_3 wp-post-image" alt="Como Escrever Uma Boa Redação">
 " class="attachment-atbs-s-4_3 size-atbs-s-4_3 wp-post-image" alt="Concurso INSS edital 2022 publicado">


